
The conclusion first: this debt crisis will most likely never have a day of default. The debt will be settled by printing money, and the price will be the purchasing power in everyone's hands.
The endgame of a debt crisis is not default but dilution — you get every digit of your money back, while what that money can buy quietly shrinks.
From 2% to 5.216%: Borrowing Got Expensive
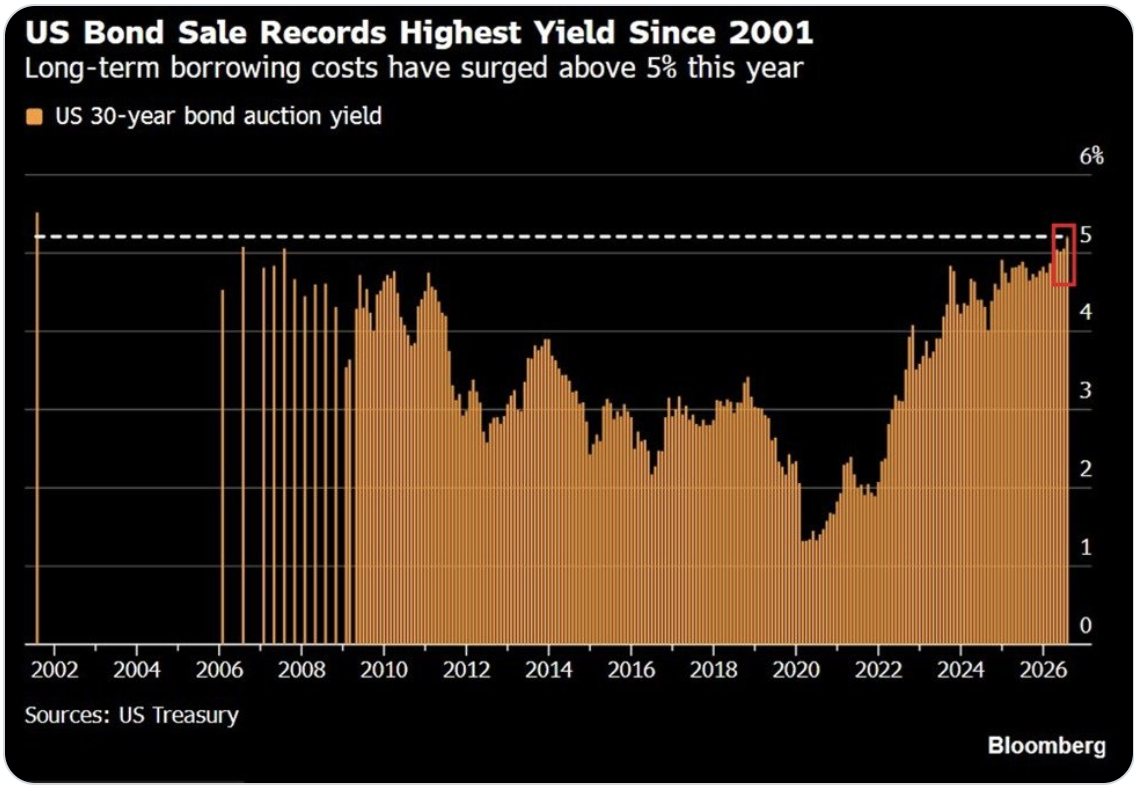
This story starts in 2020. That year, to fight the pandemic, the world's major countries borrowed heavily together, with deficits generally surging to 15% to 25% of GDP. Borrowing was cheap then — the yield on a 30-year Treasury was under 2%.
Then on August 13 this year, the United States auctioned another 30-year Treasury. This time the yield was 5.216%5.216%The awarded yield at a Treasury auction: the price at which the market is willing to lend to the government — the higher the number, the more expensive the government's borrowing, the most expensive in 25 years. And the climb hasn't stopped — in just the past couple of days, the 30-year yield rose again to 5.3%. For lending the same amount of money to the U.S. government, the cost has nearly tripled in six years.
Looking back from 2026, putting three asset trends side by side is glaringly abnormal: U.S. Treasury yields keep hitting new highs, the dollar is weakening, and gold is surging. The newsletter version can only show static charts; here the three lines are displayed for the most recent week by default, with a one-click switch to the full six-year view —
Source: Yahoo Finance (^TYX / DX-Y.NYB / GC=F, daily, refreshed daily); the 8-13 auction is the event verified in the text.
Hard to Go Back: Borrowing Without a Crisis
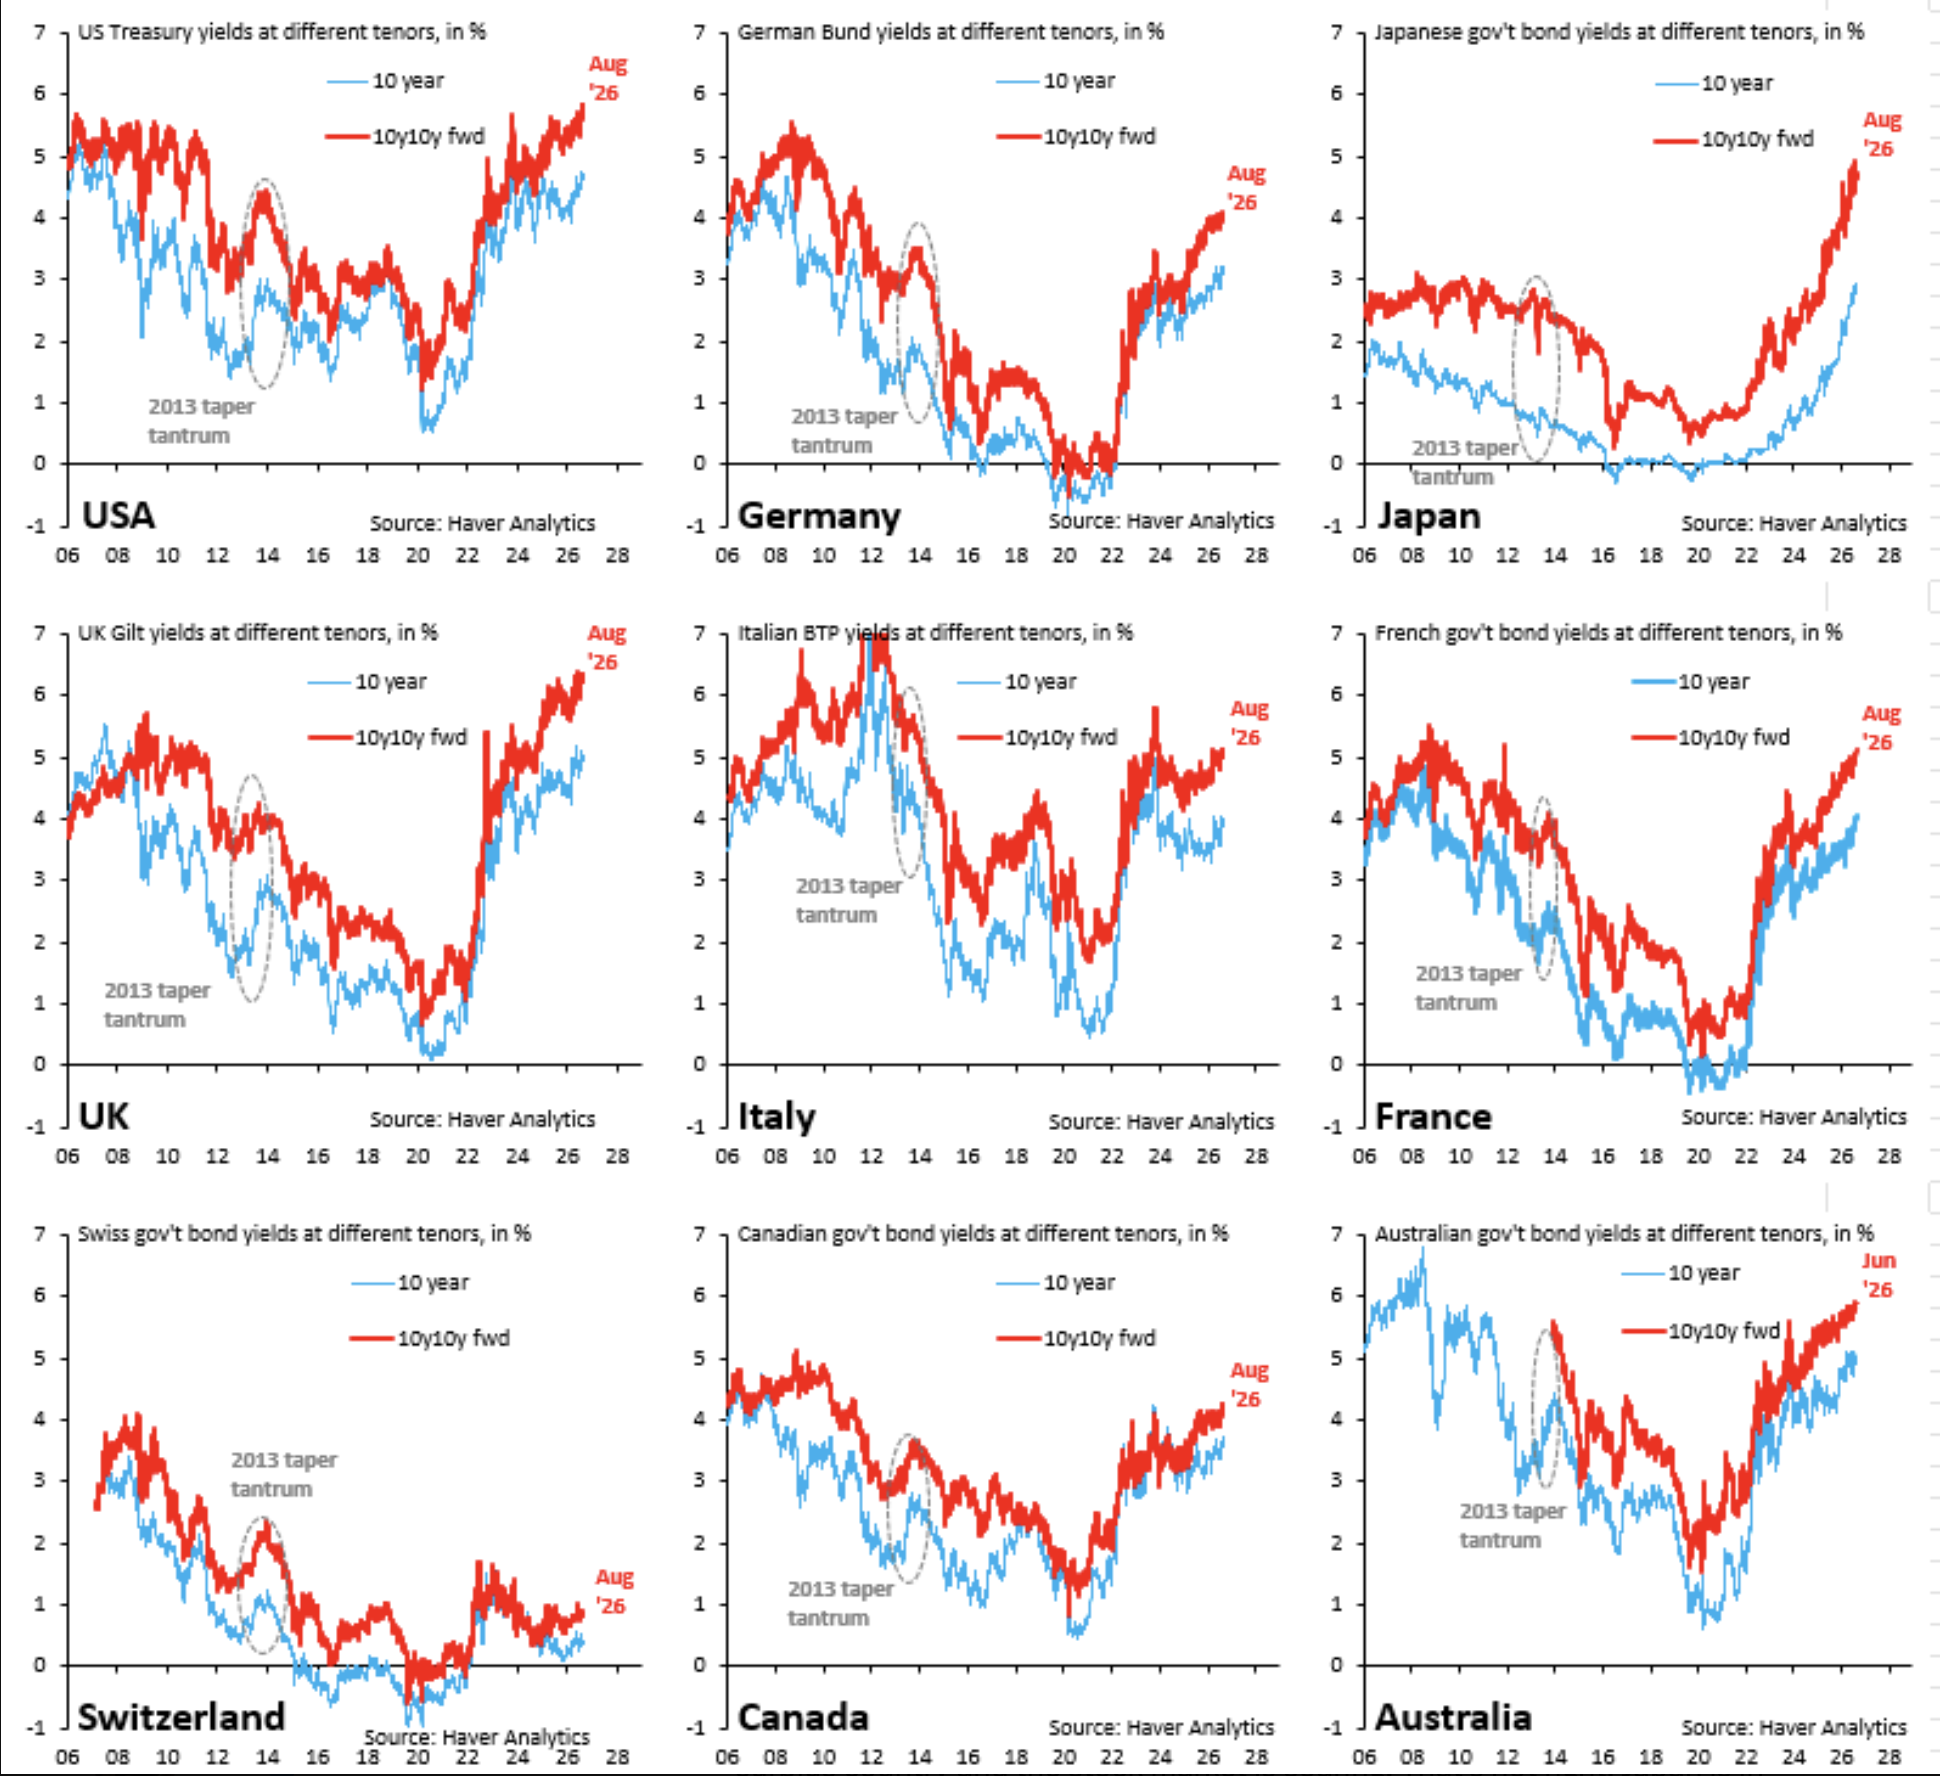
Logically, once the pandemic ended, spending should have tightened. But it is hard to go back to frugality after extravagance. Major countries, with no recession and no crisis, are still borrowing heavily. Take the United States: the federal deficit is running around 7% of GDP, versus an average of about 3% before the pandemic. And it's not just the U.S.
In recent years, a sizable share of the profits of U.S. listed companies has effectively come from federal government borrowing — which is also why U.S. equities' EPSEPSEarnings Per Share: company profit divided by total shares outstanding, the most commonly used earnings metric for U.S. stocks has kept growing.
Three Paths, Only One Left
This game cannot go on forever. There are three paths on the table.
The first: default. A dead end — it would utterly destroy national credit. U.S. Treasuries are the collateral of the global credit system; defaulting would mean flipping over the card table.
The second: cut spending. Also a dead end. First, welfare, military spending, interest — whichever you cut costs votes. Second, as noted above, corporate profits are being sustained by government borrowing; the moment you tighten, stock prices can't hold up.
The only remaining path: print money to pay the debt.
How does printing money settle the books? Debt is a number on paper; purchasing power is the real meat. You get every digit of your money back, while what that money can buy quietly shrinks — and everyone holding cash picks up the bill.
The Market Is Already Pricing It In
The market is in fact already pricing this in. The 10-year Treasury is at 4.68%, of which the real rate is 2.41% and inflation compensation 2.27%. The inflation price the market itself sets for the coming decade is already above the Fed's 2% target. Even more abnormal: with the real rate at 2.41% — a high level — gold is still rising. Under the traditional pricing framework, this is precisely the most inexplicable combination.
Data are the levels verified in the text as of 2026-08-17; not a continuous series.
The Yen Lesson: Collateral Must Not Be Sold
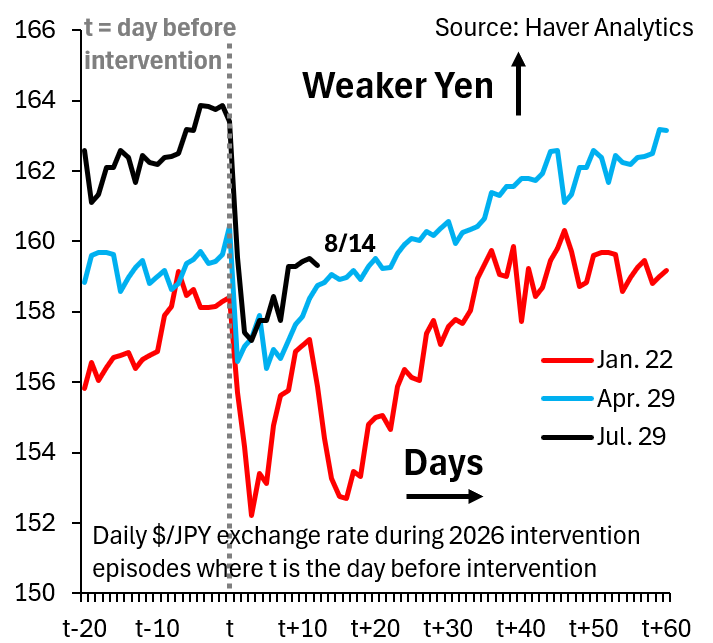
A recent episode made this explicit. The Bank of Japan spent $85 billion over two days in late July to defend the exchange rate, only for the yen to fall back within days. In the end, U.S. Treasury Secretary Bessent stepped in personally to help — but the manner of help was carefully crafted.
To rescue the yen, you have to swap dollars for yen in the market. The Bank of Japan doesn't hold that much ready cash in dollars; its biggest asset is over a trillion dollars of U.S. Treasuries. The normal approach would be to sell some Treasuries for dollars first, then buy yen. But the U.S. is issuing debt furiously and fears nothing more than its biggest creditors leading a sell-off. If Japan actually dumped, Treasury yields would jump immediately — shooting itself in the foot.
Bessent's solution: Japan pledges its Treasuries to the United States, borrows dollars against them, and uses those dollars to rescue the yen. The bonds remain pledged under Japan's name, so no selling is visible in the market. The U.S., for its part, sells euros to buy yen (without consulting the ECB — further damaging the dollar's credit). This step was equally deliberate: if the Treasury directly sold dollars to buy yen, it would amount to an official admission that the dollar is going to fall.
Yet the money was spent with little to show for it — the yen fell back within days. Japan's root ailment is interest rates; without hiking them, the relentless depreciation trend cannot be reversed.
A former U.S. Treasury official saw it clearly: from the day foreign central banks realized the Treasuries in their hands could not be freely sold, the dollar's status as the reserve currency had already changed, and reserve diversification would only accelerate. What central banks went on to buy — you already know.
Only Gold and Silver Remain
Debt is snowballing, currencies are depreciating, and U.S. corporate profits are still on life support from borrowing. Counting it all up, the only genuinely reliable safe assets left are gold and silver. Gold is up 8.2% this month, and China's central bank has bought for 21 straight months — buying more as prices rise. That's the logic.
Below are my judgment records from my community over this period, original texts and conclusions included: the gold-silver turning signal, gold holding above 4,100, and the original community post from August 13.


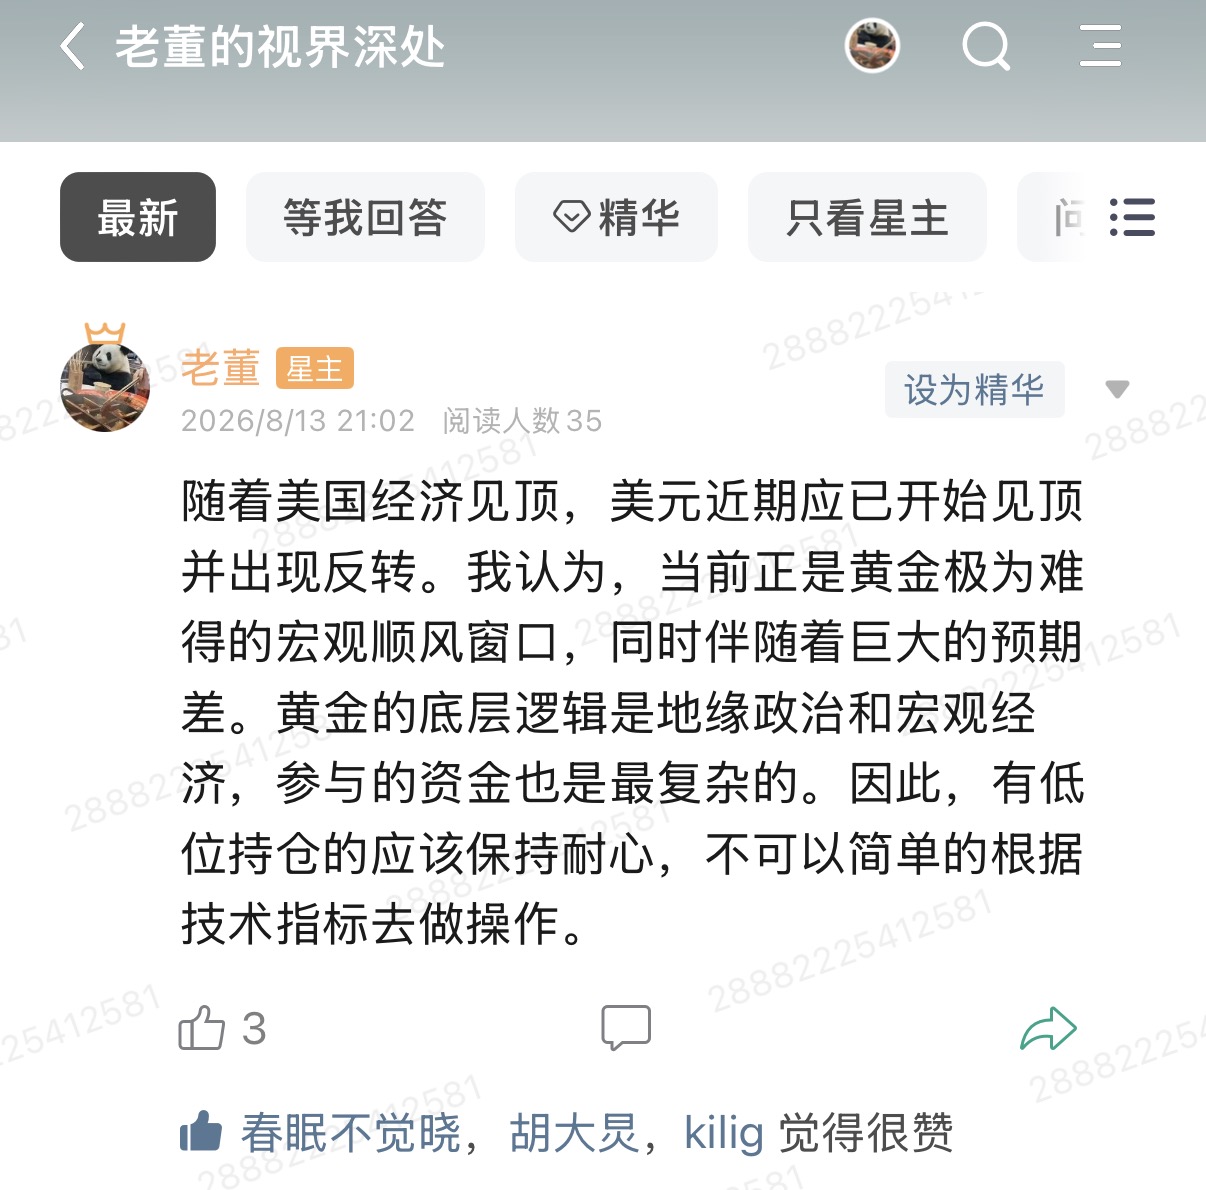
The earlier gold calls have since played out. Inside the community, I will continue to track gold, silver, the dollar, Treasuries, geopolitics, and the rhythm of major asset classes.